In a previous post, I showed how to leverage system test components to find memory leaks. The same technique can be applied to other types of performance problems.
Using a traditional profiler would highlight areas of code with performance issues. The problems could be anything from an unoptimized SQL query to process intensive code to excessive looping.
The overall testing process remains the same:
- Attach a profiler
- Exercise the application in a loop
- Take a snapshot using the profiler
An example
As before, the technique used is tooling agnostic. I’m using TestComplete and dotTrace for the example below. But you can use whichever tools you prefer to get the same outcome.
Slow code
The previous example showed an event handler leak in the constructor for CategoryListItemViewModel. This time, let’s change the constructor to run a (very) inefficient loop:
public CategoryListItemViewModel(Category category)
{
  _category = category;
  PerformSlowActivity();
}

private void PerformSlowActivity()
{
  var end = DateTime.Now + TimeSpan.FromSeconds(2);
  while (DateTime.Now < end)
  {
    /* do nothing */
  }
}
The rest of the code remains the same as the previous code sample.
Performance testing utility
Since the same utility test will be used in this example, here’s a refresher. The outer flow for the utility test defined previously was:
function Main()
{
  app.Start();
  WaitForProfilerStart();
  RunLoops();
  WaitForProfilerStop();
  app.Close();
}
Running the test
To look for performance problems, I’d run that same utility test used previously. But this time I’d attach a traditional profiler instead of the memory profiler.
In other words, the only thing I’m changing between the two test runs is which profiler I’m attaching. Outside of that change, the utility test operates exactly the same. It performs the same activities and loops the same number of times.
Evaluating the results
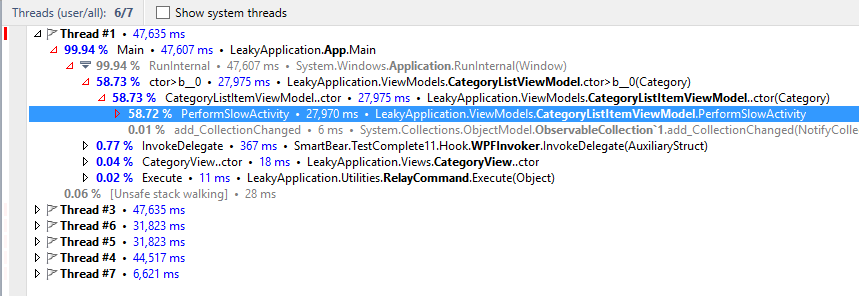
The resulting profiler trace shows which call paths ended up consuming the most time. In this example, as expected, the PerformSlowActivity method is implicated.
This strategy allows you to narrow in on potential performance bottlenecks in an application. Since the work of looking for performance issues is codified in a test utility, it becomes easy to repeat this test to verify fixes work as designed.
You can even build a step into your process to run these performance tests periodically. I’ve often run these sorts of tests at least monthly on projects. Even at that frequency, it helped find and correct potential problems before they showed up in production.
