Recently, we had a book club where we read the Mikado Method, a process of handling large scale rearchitecting via refactors on the Master Branch without adversely impacting new features. One of the techniques that make up the method is visualizing the refactoring plan as a digraph of dependent steps. But as much as I love sketch notes, fountain pens, and sharpies, I can make a right mess of a piece of paper when I can’t fit all the nodes on a graph where I want.
Enter GraphViz. It’s a suite of tools for laying out diagrams. In particular, I learned just enough of the dot language to track my work. Here’s an example Mikado Graph where we are replacing a legacy data store with a new database engine.
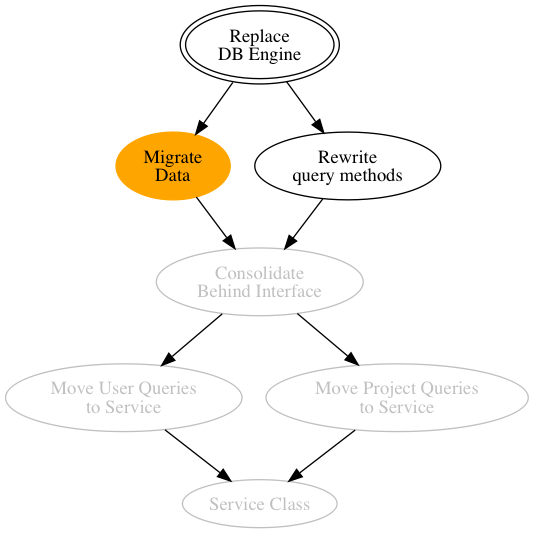
digraph G { subgraph finishedTasks { node[color=”gray”, fontcolor=”gray”]; “Service Class” “Move User Queries\nto Service” “Move Project Queries\nto Service” “Consolidate\nBehind Interface” } subgraph currentTask { node[color=”orange”, style=filled]; “Migrate\nData” } goal [peripheries=2, label=”Replace\nDB Engine”] ; goal -> “Migrate\nData” -> “Consolidate\nBehind Interface” goal -> “Rewrite\nquery methods” -> “Consolidate\nBehind Interface” “Consolidate\nBehind Interface” -> “Move User Queries\nto Service” “Consolidate\nBehind Interface” -> “Move Project Queries\nto Service” “Move User Queries\nto Service” -> “Service Class” “Move Project Queries\nto Service” -> “Service Class” }
And here’s what it looks like. The Double Line represents the ideal goal state. The arrows show work that’s dependent on other work. The orange is the task currently being worked on, and the gray nodes are tasks we have completed. While this example is from a real use case, the actual graphs tend to be larger and emerge over time as we uncover more dependencies. So leaving a trail like this is super useful for an effort that spans several days or weeks with multiple commits a day. And I can slack the image so the team knows how things are going.
How to DOT
- digraph – This allows us to use connections with arrows
- node definition – A node is either a bare word, or a string. Nodes use “automatic semicolon insertion” just like javascript. You can put several statements on a line if you use a semicolon between them.
- styling nodes – You can style nodes by using a node command to modify all the nodes in a graph or by adding attributes to a node. I used attributes on the goal node.
- subgraph – This allows me to style all the nodes at once. I just need to mention that a node exists in the subgraph and have the connection in the main graph below.
- node connections – I’m using a digraph, so the nodes need to be connected with an arrow ->. I can chain several connections together. I can mention nodes repeatedly.
The edit cycle
- Write the file: mikado.dot
- Run dot: dot -Tpng -omikado.png mikado.dot
- Open the file: open —background mikado.png
open is a macOS specific program. Windows folks can use
. For linux, try ***open*** or check with your distro or tell someone on the internet it can’t be done and they will correct you loudly.
How to faster
First, I wrote a shell script to combine two steps. Write the script and open the picture. I’ll call it openDot.sh.
#! /bin/sh
INFILE=$1
FILEBASE=basename $1 .dot
DIR=dirname $1
OUTFILE=”$DIR/$FILEBASE.png”
dot -Tpng -o$OUTFILE $INFILE
open –background $OUTFILE
Now I can run ./openDot.sh mikado.dot and the png opens in preview!
But that’s still too much work. I need to use fswatch to pump out the updated file and xargs to update. (get you a bash subsystem. git-bash if nothing else) .
Seriously. Learn xargs. Soooo Goood
Great, but now what?
You can write graphs by hand, or write them with scripts!
- Sketch out relations to discuss.
- Document a state machine.
- Generate database tables used by your rails app.
- Auto generate dependency graphs.
- Mind maps.
- Anything!
