
Many people are keenly interested in machine learning, and with good reason. Machine learning is applicable to a wide variety domains, including engineering, education, healthcare, and government. The broad applicability of machine learning is a double edged sword: Although an ever increasing pool of people want to use machine learning, a decreasing portion of them understand the mathematics and computer science that are it’s foundation.
Just because people don’t natively speak the language of machine learning doesn’t mean that they’re not going to try to apply machine learning to their problems. We should provide tools to the fledgling machine learning practitioner that allow them to understand what they’re asking the system to do. The tools ought to make it difficult to ask the system something inherently wrong, and they should make users confident in their ability to interpret results. Anything less invites misapplication of machine learning techniques.
Companies have additional constraints on software used to solve a problem. They may be fundamentally limited in where data is allowed to reside or how it is allowed to move. They may be specifically disallowed from using libraries with certain licenses, or they may have other cumbersome requirements on procuring software and libraries for use. Achieving widespread adoption requires addressing individual and corporate hurdles to adoption alike.
The Pipeline
When we built our machine learning pipeline, we did so thinking about what sits between an individual or a company and the adoption of machine learning techniques. We believe that those barriers are:
- Individuals lack fluency in programming and/or mathematics
- Data are neither centralized nor groomed
- Companies are very protective of their data
Given these constraints, we chose to wrap existing machine learning libraries. While offerings like TensorFlow and scikit-learn are exceptionally powerful, they are also exceptionally complex. Complexity is a barrier to entry that we try to lower by:
- making obvious mistakes fail early and loudly
- providing reasonable defaults for algorithm configuration
- focusing on evaluation and comparison of trained learners
- focusing on visualization and inspection of the data sources themselves
There are four core elements of any machine deployment: loading data, inspecting data, engineering features, training and evaluating machine learning algorithms; note that training and evaluation are a single element. Guardrails and automation are placed around each of these core actions to simplify the process. In addition to this simplification, we focused our efforts on performing machine learning on a single machine. While distributed solutions are more powerful, they have two drawbacks:
- That power comes at the cost of ease of use
- You probably don’t own any cloud infrastructure, so you have to use someone else’s
Ideally, a beginning practitioner can test out the applicability of machine learning on their desktop and use those results to support further investment in machine learning at a company. We naturally think of dollars when mentioning investment, but it could also mean headcount, hours, or the risk incurred by moving data offsite.
Using Visualization to Improve User Performance
An extremely common and useful application of machine learning is to identify which to which group does something belong. This is typically answered using supervised learning techniques, and it can be applied to problems from answering if a truck in a fleet is going to fail to identifying hand written characters. However, just because the technique is widely applicable doesn’t mean it will work well for a specific dataset. In any ML engagement, the first question we should ask is “Can the target concept can be learned from the underlying data?”
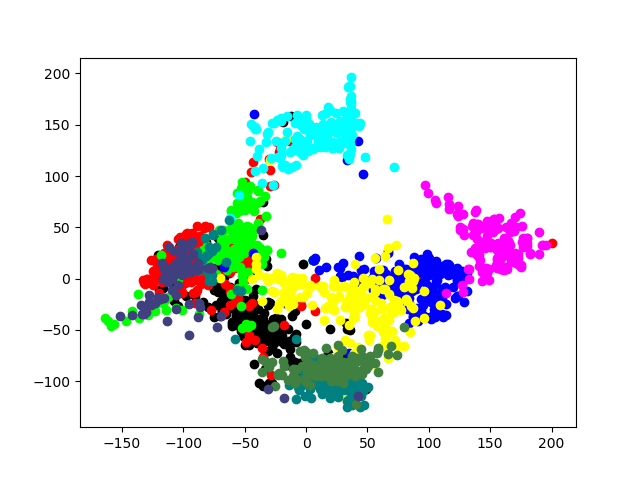
There are a variety of approaches to answering this question, but we’ve found visualizations like the image above particularly helpful. The plot is a scatter plot of elements in the dataset, colored by membership in a group. Specifically, we’re looking at the ten different digits, zero through nine, represented on the scatter plot. In the image, we see good separation between the classes. There is some overlap, but not total overlap, and not for all classes. We can be pretty confident that moving forward with the dataset as it is will result in a strong classifier capable of accurately recognizing digits before we begin building the classifier.
Though we’re showing a 2D plot, the digit dataset has sixty four dimensions. Each represents a particular cell in an image that is eight pixels wide and eight pixes tall. The pipeline provides a visualization that computes a projection of high dimensional data onto a two dimensional space. Reducing the dimensionality of the dataset allows us to apply the natural intuitions we have about 2 and 3 dimensional spaces as individuals who must interact with the physical world around us to arbitrary datasets.
Using Compute Time Rather Than Human Effort
If the visualization had instead shown us that the dataset was not well separated, we would have had to make some difficult decisions. Among our choices are accepting a noisy classifier for the target concept, leveraging additional data sources not initially provided, and refining our current data sources to allow for more accurate classification. Accepting the current quality is, ultimately, a business consideration that the pipeline can’t make on anyone’s behalf; however, it can provide evaluations to help inform the decision. Additional relevant data sources aren’t always available, and when they are they may be costly to acquire. Conversely, it’s always possible to further manipulate the data you have to see if cleaner data or a different lens can help improve the performance of machine learning.
This last option is called feature engineering. Feature engineering is powerful, but it’s also labor intensive. To help offset that cost, we’ve added some automated feature exploring into our machine learning pipeline. We provide a variety of common transforms (logarithms, integer truncation, polynomial combinations of features, dropping a feature altogether) that are things we’ve found are generally useful in learning some concept from a dataset. In addition, we provide tools for trying out all of the possible combinations of transforms on all of the elements of your datasets in some order. The idea here is that while your time is valuable the computer’s time is not.
Conclusion
Tools like our pipeline are part of an effort to lower the bar to entry in machine learning. The Internet is full of libraries, tutorials, example projects, lectures, and wikis which are designed to make machine learning accessible to programmers of all stripes.
These are wonderful resources, but we felt they came up short in a few respects. We didn’t think that the integration between training an algorithm on a dataset, evaluating an algorithm on a dataset, and visualizing either the dataset itself or the algorithms’ performance on the dataset was tightly integrated enough in the tools that are already available.
Current resources assume a certain level of programming proficiency, but often we’re working with domain experts who have no or limited programming experience. We want to provide those domain experts with easier access to machine learning. They’re already spending a large portion of their time dealing with structured data, evaluating performance, and looking for patterns and trends. We want to make it easier for them to do that.
